The population of France (2021) is 67,413,000. This estimate was produced in May 2021 by the French National Institute of Statistics and Economic Studies (Insee).
France is the 20th largest country in the world, the fourth largest country in Europe, and the second largest country in the European Union.
France’s population is growing steadily, and it is today the fastest growing country in the European Union.
How many people live in France today?
When considering how many people live in France, it is important to understand that France itself is divided into two parts – Metropolitan France and the Overseas Departments and Territories of France.
The largest part is known as Metropolitan France. This is the part of France that is actually in Europe. It has a population of 64,570,000.
The other part of France is its overseas departments which, despite being scattered all around the world (see: What Continent is France in?), are considered integral parts of France. Their residents are citizens of France, use the Euro as their currency, and are represented in the French parliament and the European Parliament.
There are five main French overseas departments, which, together with a small number of overseas territories, have a population of 2,119,000. The five French territories are:
Réunion, Indian Ocean844,944
Guadeloupe, Caribbean403,750
Martinique, Caribbean385,551
French Guiana, South America250,109
Mayotte, Indian Ocean212,645
Because parts of France are scattered across the world, it is what is known as a Trans-Continental country. See our article ‘What continent is France in?’ for more details.
Population growth in France
France has one of the highest natural population growth rates in the European Union. Although population growth was flat during the first half of the 20th century, its population has been growing steadily ever since and is currently growing at around 0.6% per annum.

France’s population is projected to rise steadily in the next few decades. By 2030, the population is expected to rise to over 70 million and, by 2055 there are likely to be more people living in France than there are living in Germany.
Because of the first and second world wars and the impact of the 1930s Depression in Europe, the population of France did not grow significantly between 1900 and 1945.
The population of France in 1914 was 41.6 million , a high that it was not to reach again until 1950.
The population of France fell by more than 2.5 million during the First World War, to 38.6 million. Although it recovered briefly in the 1920s and early 1930s to 41.5 million, the population was to be decimated again in the late 1930s and during the Second World War.
By 1945, the population of France had dropped again to just 39.6 million people. Renewed confidence after the end of the war saw a dramatic rise in birth rates, and France’s baby boom generation was born.
Ethnic groups in France
Since 1872 a law has been in place which prevents the French Government from collecting data on ethnicity, so official data is not available.
INSEE does, however, collect data on nationality. This showed that, in 2010, 89.7% of people in France were French by birth.
French (by acquisition)4.4%
A further 4.4% of people in France were French by acquisition, 5.9% were foreign, and 8.6% were immigrants.
Ethnic French people are descended from a number of European peoples, including Celts, Iberians, Italians, Germans and Greeks. Immigrants into France over the past century mainly come from its former colonies and, more recently, from around the European Union and the globe.
An Institut Montaigne estimate, published in the Economist, argues that the the population of France in 2004 was made up of the following ethnic groups:
North African5.5 million (9%)
Religions in France
France is a secular country, and does not collect data on religion in its census.
However, a number of surveys have been conducted which demonstrate that Christianity remains, by far, the largest religion in France, followed by Islam as France’s second religion.
One of the most recent surveys, undertaken in 2012 by the Institut CSA (Consumer Science & Analytics) reported that 56% of French people regarded themselves as Christians, 32% had no religion, and 6% were Muslims.
This is broadly in line with other surveys undertaken in recent years.
Almost all of the reported Christians in France are Roman Catholic.
Languages in France
French is the official state language of France, and the most widely spoken language. It’s status is protected in the French constitution and it must by law be used in all official communications, as well as in any workplace or commercial communication.
France also has a wide range of regional languages, although none of them have official status. These are spoken as secondary languages, alongside French. They include Celtic languages (such as Breton), German languages (such as Alsatian and French Flemish) and Gallo-Romance languages (such as Languedocien).

Language map of France (source).
A number of additional languages have been introduced into France by immigrants, including Arabic, which is the most widely spoken second language in France, and Berber, a North African language.
There is not much data available about the number of people who speak various languages in France. The most recent available is a 1999 survey by the Institut national de la statistique et des études économiques (INSEE) which indicated that French was the mother tongue of 39.36 million people in France, followed by German dialects (0.97 million) and Arabic (0.94 million)
Germanic dialects0.97 million
There are also a number of languages spoken alongside French in its overseas departments.
Education and literacy rate
The public education system in France is divided into primary, secondary and higher education. It is regulated centrally by the Ministry of National Education and teachers and university professors are all state employees.
Attendance at school is compulsory from the age of 6 until the age of 16, although most French children will also attend nursery school from the age of 3 or 4.
Most higher (university) education is state funded, although students do often have to pay a small tuition fee. The fees are set by the state, and the average is €190 per year. Some courses charge slightly higher fees, for example engineering (€620/year) and medicine (€452/year).
There are approximately 2.3 million students in tertiary education in France, a number that is roughly comparable with the UK (2.6 million) and Germany (2.4 million).
Literacy rate in France
Literacy rates in France have not been collected by INSEE since 2004.
Figures from 2003 show that France’s literacy rate is one of the highest in the world, at 99% for both male and female.
There is no reason to suggest that there has been a significant change in these figures since 2003.
Population Density in France
Although France is the second largest country by population in the European Union, it is also the largest country by area in the European Union.

Source: Der Statistiker
This means that France is less densely populated than other European countries with a comparable population, such as the UK or Germany.
The area of Metropolitan France (the part of France in Europe) is 551,695 square kilometres. So, with a total 2016 population of 64,750,000 in Metropolitan France, we can see that Metropolitan France has a population density of 117.37 people per square kilometre.
If we include France’s overseas departments and territories, the area of France increases to 643,801 square kilometres. The population (2016) also increases, to 66,689,000. By dividing 66,689,000 by 643,801, we see that the overall population density of France is 103.57 people per square kilometer.
The population density of France’s overseas departments and territories is far lower than the population of Metropolitican France. It’s population density is just 21.05 people per square kilometer.
Largest cities in France
Paris is the largest city in France. The population of Paris (2012) is 2,240,621 people. It is the fifth largest city in the European Union (after London, Berlin, Madrid and Rome) and the ninth largest city in the tt of Europe.
This is lower than the highest population recorded in Paris, which was 2.9 million people in 1921.
In the wider Paris urban area there is a much larger population of 10,550,350 people. The Paris urban area includes the built up suburbs and areas around the city of Paris, and is the most populous urban area in the European Union.
In the Paris metropolitan area (which includes the city proper, its suburbs, and other urban areas within commenting distance of Paris) there is a population of 12,405,426. This is the second largest metro area in the EU, after London which has a population of 14 million.
Other major cities in France include Marseille (population 852,516), Lyon (496,343), Toulouse (453,317), and Nice (343,619). Here is a list of the ten largest cities in France by population (based on 2012 data).
[table “33” not found /]
Saint-Denis, in Réunion, is the largest city in France’s overseas departments and the 21st largest city in France overall. It has a population of 142,244.
(Saint-Denis in Réunion should not be confused with Saint-Denis in Île-de-France, which is home to 108,274 people and is France’s 37th largest city.)
St Pierre in Reunion is second largest overseas city. It has a population of 81,415.
Other French demographic data
Sex ratio
The overall sex ratio (the ratio of males to females) in France is 0.96 males to every female (2015 estimate).
Total population0.96 male(s)/female
At birth there are 1.05 males to every female. Aged 65 or over there are 0.75 males to every female.
At birth1.05 male(s)/female
0-14 years1.05 male(s)/female
15-24 years1.05 male(s)/female
25-54 years1.01 males(s)/female
55-64 years0.93 male(s)/female
Over 65 years0.75 male(s)/female
This is roughly similar to the EU average.
Life expectancy
Overall life expectancy in France is 82 years. This is the highest life expectancy in the European Union and the ninth highest in the world.
Overall life expectancy83 years
Male life expectancy78.7 years
Female life expectancy85.2 years
Life expectancy for men in France is 78.7 years (sixteenth in the world) and life expectancy for women in France is 85.2 years (fourth in the world).
Median age
The median age in France is 40.9 years.
Male Median Age39.3 years
Female Median Age42.4 years
For French men, the median age is 39.3 years and for French women the median age is 42.4 years.
Birth and death rate
The birth rate and fertility rate in France are both among the highest in the European Union.
The 2015 birth rate in France is 11.9 births per 1,000 population. This is higher than the EU average of 10.1 births per 1,000 population (2014 data).
The 2015 death rate is 9.2 deaths per 1,000 population. This is slightly lower than the EU average of 9.9 deaths per 1,000 population.
Birth Rate11.9 births per 1,000 population
Death Rate9.9 deaths per 1,000 population
Fertility rate
The fertility rate in France is also one of the highest in the European Union. After many years of decline during the 20th century, the fertility rate in 2012 was 2.01 children per woman.
This is considerably higher than the EU average of 1.6 children per woman, and is close to what is known as the replacement rate – the number of children needed to ensure that the population remains stable.
Fertility Rate France2.01
Fertility Rate EU average1.6
France Diplomatie puts this down to family friendly government policies in France, including benefits and tax allowances for families, and generous maternity and paternity leave policies.
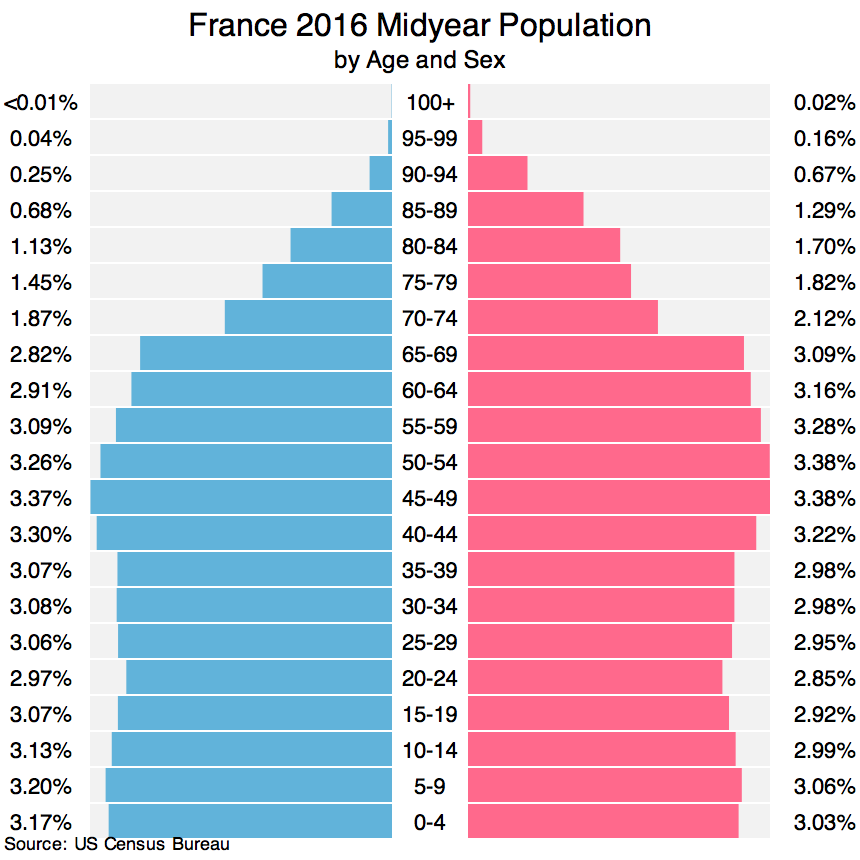
French population pyramid
Here is a French population pyramid, based on 2016 data.


